在机器学习中利用统计插补来处理缺失值(附代码)

缺失值必须被标记为NaN,且可以被用统计方法计算出的列的值来替代。
如何载入一份带有缺失值的CSV文件,用NaN来标识缺失值,展现出每一列的缺失值数量和百分比。
如何用统计量来填充缺失值,作为数据准备方法中的一个步骤,用于评估模型和用最终模型和新数据来拟合预测结果。

教程综述
1. SimpleImputer 数据转换
2. SimpleImputer 和模型评估
3. 比较不同的插补统计量
4. 在预测时进行SimpleImputer转换
统计插补
“这些值有可能以多种形式来表示。我见过的形式比如有完全为空,一个空的字符串,“NULL”字段、“N/A”或“NaN”,再就是数字0等等。不管它们以什么样的形式出现在你的数据集里,你要清楚自己的目的,并且确定这些数据的作用匹配达到你的预期,这样将会使你在开始使用数据时减少问题的存在。”
整列的平均值
整列的中位数值
整列的众数值
一个常数值
病马数据集
2,1,530101,38.50,66,28,3,3,?,2,5,4,4,?,?,?,3,5,45.00,8.40,?,?,2,2,11300,00000,00000,21,1,534817,39.2,88,20,?,?,4,1,3,4,2,?,?,?,4,2,50,85,2,2,3,2,02208,00000,00000,22,1,530334,38.30,40,24,1,1,3,1,3,3,1,?,?,?,1,1,33.00,6.70,?,?,1,2,00000,00000,00000,11,9,5290409,39.10,164,84,4,1,6,2,2,4,4,1,2,5.00,3,?,48.00,7.20,3,5.30,2,1,02208,00000,00000,1...
Horse Colic Dataset
Horse Colic Dataset Description
...# load dataseturl = 'https://raw.githubusercontent.com/jbrownlee/Datasets/master/horse-colic.csv'dataframe = read_csv(url, header=None, na_values='?')
...# summarize the number of rows with missing values for each columnfor i in range(dataframe.shape[1]):# count number of rows with missing valuesn_miss = dataframe[[i]].isnull().sum()perc = n_miss / dataframe.shape[0] * 100print('> %d, Missing: %d (%.1f%%)' % (i, n_miss, perc))
# summarize the horse colic datasetfrom pandas import read_csv# load dataseturl = 'https://raw.githubusercontent.com/jbrownlee/Datasets/master/horse-colic.csv'dataframe = read_csv(url, header=None, na_values='?')# summarize the first few rowsprint(dataframe.head())# summarize the number of rows with missing values for each columnfor i in range(dataframe.shape[1]):# count number of rows with missing valuesn_miss = dataframe[[i]].isnull().sum()perc = n_miss / dataframe.shape[0] * 100print('> %d, Missing: %d (%.1f%%)' % (i, n_miss, perc))
0 1 2 3 4 5 6 ... 21 22 23 24 25 26 270 2.0 1 530101 38.5 66.0 28.0 3.0 ... NaN 2.0 2 11300 0 0 21 1.0 1 534817 39.2 88.0 20.0 NaN ... 2.0 3.0 2 2208 0 0 22 2.0 1 530334 38.3 40.0 24.0 1.0 ... NaN 1.0 2 0 0 0 13 1.0 9 5290409 39.1 164.0 84.0 4.0 ... 5.3 2.0 1 2208 0 0 14 2.0 1 530255 37.3 104.0 35.0 NaN ... NaN 2.0 2 4300 0 0 2[5 rows x 28 columns]
> 0, Missing: 1 (0.3%)> 1, Missing: 0 (0.0%)> 2, Missing: 0 (0.0%)> 3, Missing: 60 (20.0%)> 4, Missing: 24 (8.0%)> 5, Missing: 58 (19.3%)> 6, Missing: 56 (18.7%)> 7, Missing: 69 (23.0%)> 8, Missing: 47 (15.7%)> 9, Missing: 32 (10.7%)> 10, Missing: 55 (18.3%)> 11, Missing: 44 (14.7%)> 12, Missing: 56 (18.7%)> 13, Missing: 104 (34.7%)> 14, Missing: 106 (35.3%)> 15, Missing: 247 (82.3%)> 16, Missing: 102 (34.0%)> 17, Missing: 118 (39.3%)> 18, Missing: 29 (9.7%)> 19, Missing: 33 (11.0%)> 20, Missing: 165 (55.0%)> 21, Missing: 198 (66.0%)> 22, Missing: 1 (0.3%)> 23, Missing: 0 (0.0%)> 24, Missing: 0 (0.0%)> 25, Missing: 0 (0.0%)> 26, Missing: 0 (0.0%)> 27, Missing: 0 (0.0%)
用SimpleImputer来进行统计插补
SimpleImputer数据转换
...# define imputerimputer = SimpleImputer(strategy='mean')
...# fit on the datasetimputer.fit(X)
...# transform the datasetXtrans = imputer.transform(X)
# statistical imputation transform for the horse colic datasetfrom numpy import isnanfrom pandas import read_csvfrom sklearn.impute import SimpleImputer# load dataseturl = 'https://raw.githubusercontent.com/jbrownlee/Datasets/master/horse-colic.csv'dataframe = read_csv(url, header=None, na_values='?')# split into input and output elementsdata = dataframe.valuesX, y = data[:, :-1], data[:, -1]# print total missingprint('Missing: %d' % sum(isnan(X).flatten()))# define imputerimputer = SimpleImputer(strategy='mean')# fit on the datasetimputer.fit(X)# transform the datasetXtrans = imputer.transform(X)# print total missingprint('Missing: %d' % sum(isnan(Xtrans).flatten()))
Missing: 1605Missing: 0
SimpleImputer 和模型评估
...# define modeling pipelinemodel = RandomForestClassifier()imputer = SimpleImputer(strategy='mean')pipeline = Pipeline(steps=[('i', imputer), ('m', model)])
# evaluate mean imputation and random forest for the horse colic datasetfrom numpy import meanfrom numpy import stdfrom pandas import read_csvfrom sklearn.ensemble import RandomForestClassifierfrom sklearn.impute import SimpleImputerfrom sklearn.model_selection import cross_val_scorefrom sklearn.model_selection import RepeatedStratifiedKFoldfrom sklearn.pipeline import Pipeline# load dataseturl = 'https://raw.githubusercontent.com/jbrownlee/Datasets/master/horse-colic.csv'dataframe = read_csv(url, header=None, na_values='?')# split into input and output elementsdata = dataframe.valuesX, y = data[:, :-1], data[:, -1]# define modeling pipelinemodel = RandomForestClassifier()imputer = SimpleImputer(strategy='mean')pipeline = Pipeline(steps=[('i', imputer), ('m', model)])# define model evaluationcv = RepeatedStratifiedKFold(n_splits=10, n_repeats=3, random_state=1)# evaluate modelscores = cross_val_score(pipeline, X, y, scoring='accuracy', cv=cv, n_jobs=-1, error_score='raise')print('Mean Accuracy: %.3f (%.3f)' % (mean(scores), std(scores)))
Mean Accuracy: 0.842 (0.049)比较不同的插补统计量
# compare statistical imputation strategies for the horse colic datasetfrom numpy import meanfrom numpy import stdfrom pandas import read_csvfrom sklearn.ensemble import RandomForestClassifierfrom sklearn.impute import SimpleImputerfrom sklearn.model_selection import cross_val_scorefrom sklearn.model_selection import RepeatedStratifiedKFoldfrom sklearn.pipeline import Pipelinefrom matplotlib import pyplot# load dataseturl = 'https://raw.githubusercontent.com/jbrownlee/Datasets/master/horse-colic.csv'dataframe = read_csv(url, header=None, na_values='?')# split into input and output elementsdata = dataframe.valuesX, y = data[:, :-1], data[:, -1]# evaluate each strategy on the datasetresults = list()strategies = ['mean', 'median', 'most_frequent', 'constant']for s in strategies:# create the modeling pipelinepipeline = Pipeline(steps=[('i', SimpleImputer(strategy=s)), ('m', RandomForestClassifier())])# evaluate the modelcv = RepeatedStratifiedKFold(n_splits=10, n_repeats=3, random_state=1)scores = cross_val_score(pipeline, X, y, scoring='accuracy', cv=cv, n_jobs=-1)# store resultsresults.append(scores)print('>%s %.3f (%.3f)' % (s, mean(scores), std(scores)))# plot model performance for comparisonpyplot.boxplot(results, labels=strategies, showmeans=True)pyplot.xticks(rotation=45)pyplot.show()
>mean 0.851 (0.053)>median 0.844 (0.052)>most_frequent 0.838 (0.056)>constant 0.867 (0.044)
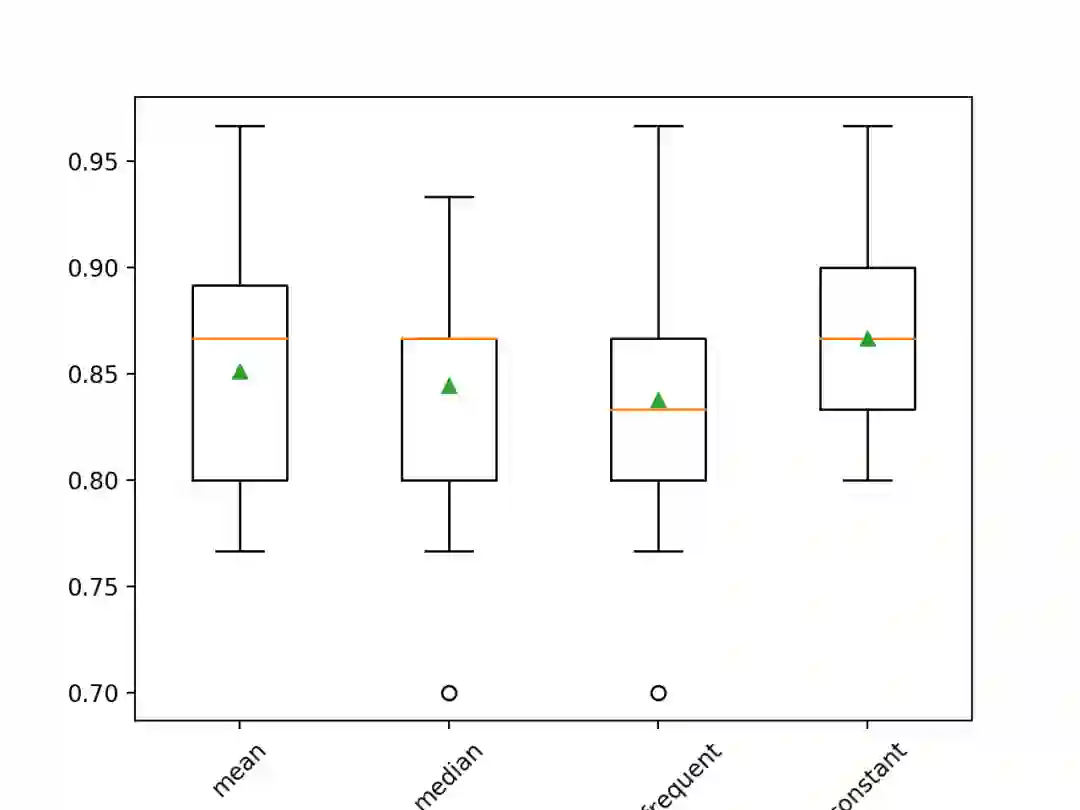
在病马数据集上利用不同统计策略的缺失值填充后所得模型结果的盒须图
在进行预测时的SimpleImputer转换
...# define new datarow = [2,1,530101,38.50,66,28,3,3,nan,2,5,4,4,nan,nan,nan,3,5,45.00,8.40,nan,nan,2,2,11300,00000,00000]
# constant imputation strategy and prediction for the hose colic datasetfrom numpy import nanfrom pandas import read_csvfrom sklearn.ensemble import RandomForestClassifierfrom sklearn.impute import SimpleImputerfrom sklearn.pipeline import Pipeline# load dataseturl = 'https://raw.githubusercontent.com/jbrownlee/Datasets/master/horse-colic.csv'dataframe = read_csv(url, header=None, na_values='?')# split into input and output elementsdata = dataframe.valuesX, y = data[:, :-1], data[:, -1]# create the modeling pipelinepipeline = Pipeline(steps=[('i', SimpleImputer(strategy='constant')), ('m', RandomForestClassifier())])# fit the modelpipeline.fit(X, y)# define new datarow = [2,1,530101,38.50,66,28,3,3,nan,2,5,4,4,nan,nan,nan,3,5,45.00,8.40,nan,nan,2,2,11300,00000,00000]# make a predictionyhat = pipeline.predict([row])# summarize predictionprint('Predicted Class: %d' % yhat[0])
Predicted Class: 2总结
缺失值必须以NaN来标识,可以计算出一列数据的统计值,然用其来替换缺失值。
如何载入一份带有缺失值的CSV文件,并用NaN来标识缺失值,展现出每一列的缺失值数量和百分比。
如何用统计策略来填充缺失值,作为数据准备方法中的一个步骤,用于评估模型和用最终模型和新数据来拟合预测结果。
作者简介
原文标题:
Statistical Imputation for Missing Values in Machine Learning
原文链接:
https://machinelearningmastery.com/statistical-imputation-for-missing-values-in-machine-learning/
译者简介

吴振东,法国洛林大学计算机与决策专业硕士。现从事人工智能和大数据相关工作,以成为数据科学家为终生奋斗目标。来自山东济南,不会开挖掘机,但写得了Java、Python和PPT。
——END——