干货!如何用 Python+KNN 算法实现城市空气质量分析与预测?


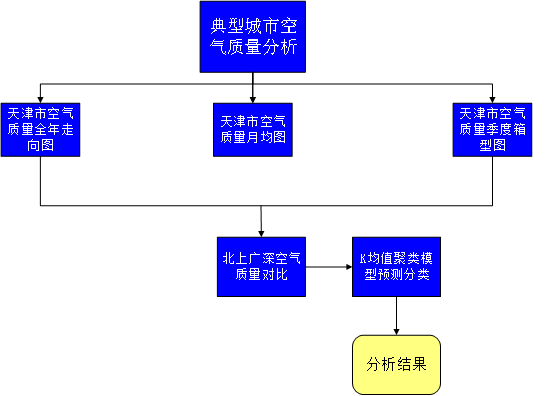

实验前的准备
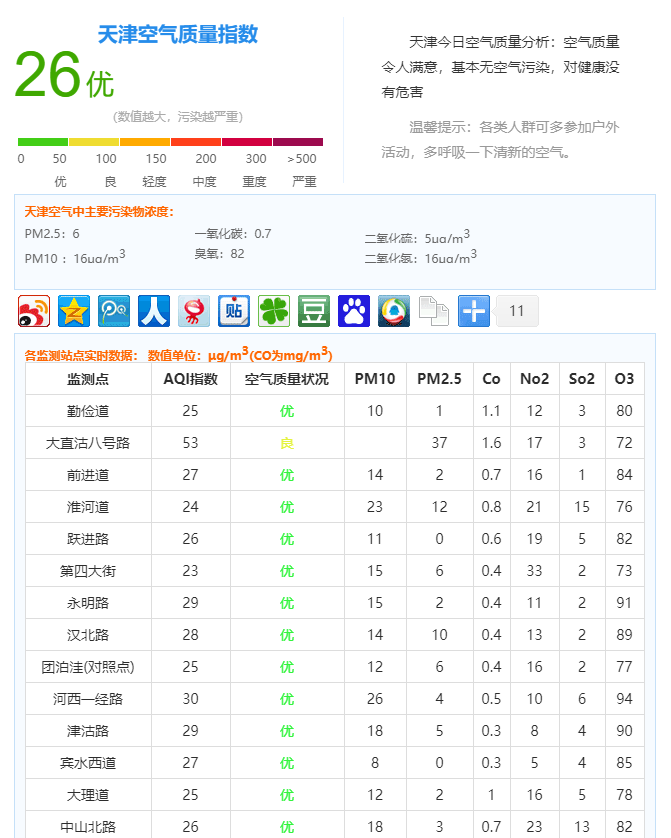
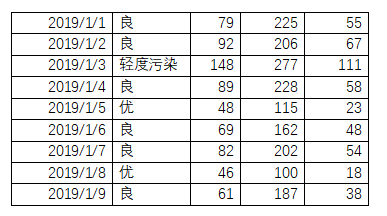
1.1 数据获取
        import time


        import requests


        from bs4


        import BeautifulSoup
      headers = {


      'User-Agent':


      'Mozilla/5.0 (Windows NT 6.1; WOW64) AppleWebKit/537.36 (KHTML, like Gecko) Chrome/63.0.3239.132 Safari/537.36'}
      for i in range(1, 13):
time.sleep(5)
url =


      'http://www.tianqihoubao.com/aqi/tianjin-2019' + str(


      "%02d" % i) +


      '.html'


response = requests.


      get(url=url, headers=headers)


soup = BeautifulSoup(response.text,


      'html.parser')


tr = soup.find_all(


      'tr')
1.2 数据预处理
      for j


      in tr[


      1:]:


td = j.find_all(


      'td')


      Date = td[


      0].get_text().strip()


Quality_grade = td[


      1].get_text().strip()


AQI = td[


      2].get_text().strip()


AQI_rank = td[


      3].get_text().strip()


PM = td[


      4].get_text()


      with open(


      'air_tianjin_2019.csv',


      'a+', encoding=


      'utf-8-sig')


      as f:


    f.write(


      Date +


      ',' + Quality_grade +


      ',' + AQI +


      ',' + AQI_rank +


      ',' + PM +


      '\n')

数据分析
      df = pd.read_csv(


      'air_tianjin_2019.csv', header=None, names=[


      "Date",


      "Quality_grade",


      "AQI",


      "AQI_rank",


      "PM"])
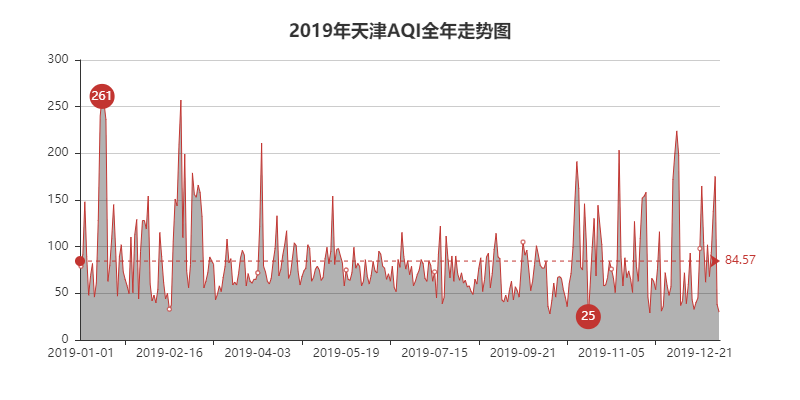
      attr = df[


      'Date']v1 = df[


      'AQI']
    line = Line(


      "2019年天津AQI全年走势图", title_pos=


      'center', title_top=


      '18', width=


      800, height=


      400)


line.


      add(


      "", attr, v1, mark_line=[


      'average'], is_fill=True, area_color=


      "#000", area_opacity=


      0.3, mark_point=[


      "max",


      "min"], mark_point_symbol=


      "circle", mark_point_symbolsize=


      25)


line.render(


      "2019年天津AQI全年走势图.html")
      air_tianjin_2019_AQI_month


      .py
      df = pd.read_csv(


      'air_tianjin_2019.csv', header=None, names=[


      "Date",


      "Quality_grade",


      "AQI",


      "AQI_rank",


      "PM"])
    dom = df


      [['Date', 'AQI']]


list1 = []


      for j


      in dom[


      'Date']:


      time = j.split(


      '-')[


      1]


    list1.append(


      time)


df[


      'month'] = list1
    month_message = df.groupby(['month'])


month_com = month_message['AQI'].agg(['mean'])


month_com.reset_index(inplace=True)


month_com_last = month_com.sort_index()


attr = [


      "{}".format(str(i) + '月') for i in range(1, 13)]


v1 = np.array(month_com_last['mean'])


v1 = [


      "{}".format(int(i)) for i in v1]
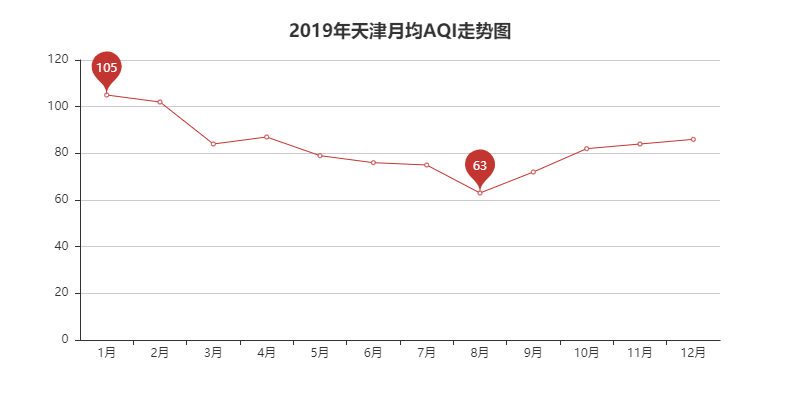
line = Line("2019年天津月均AQI走势图", title_pos='center', title_top='18', width=800, height=400)
line.add("", attr, v1, mark_point=["max", "min"])
line.render("2019年天津月均AQI走势图.html")
最终的效果图如下可见:
      df = pd.read_csv(


      'air_tianjin_2019.csv', header=None, names=[


      "Date",


      "Quality_grade",


      "AQI",


      "AQI_rank",


      "PM"])
    dom = df


      [['Date', 'AQI']]


data =


      [[], [], [], []]


dom1, dom2, dom3, dom4 = data


      for i, j


      in zip(dom[


      'Date'], dom[


      'AQI']):


      time = i.split(


      '-')[


      1]


      if


      time


      in [


      '01',


      '02',


      '03']:


        dom1.append(j)


elif


      time


      in [


      '04',


      '05',


      '06']:


        dom2.append(j)


elif


      time


      in [


      '07',


      '08',


      '09']:


        dom3.append(j)


      else:


        dom4.append(j)
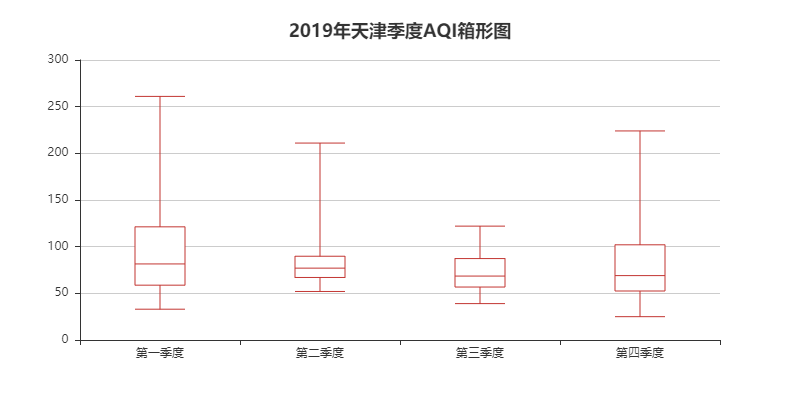
    boxplot = Boxplot(


      "2019年天津季度AQI箱形图", title_pos='center', title_top='18', width=800, height=400)


x_axis = ['第一季度', '第二季度', '第三季度', '第四季度']


y_axis = [dom1, dom2, dom3, dom4]


_yaxis = boxplot.prepare_data(y_axis)


boxplot.add(


      "", x_axis, _yaxis)


boxplot.render(


      "2019年天津季度AQI箱形图.html")

KNN算法预测
      # 文件的名字


FILENAME1 =


      "air_tianjin_2019.csv"


      # 禁用科学计数法


pd.set_option(


      'float_format',


      lambda x:


      '%.3f' % x)


np.set_printoptions(threshold=np.inf)


      # 读取数据


data = pd.read_csv(FILENAME1)


rows, clos = data.shape


      # DataFrame转化为array


DataArray = data.values


Y=[]


y = DataArray[:,


      1]


      for i


      in y:


      if i==


      "良":


        Y.append(


      0)


      if i==


      "轻度污染":


        Y.append(


      1)


      if i==


      "优":


        Y.append(


      2)


      if i==


      "严重污染":


        Y.append(


      3)


      if i==


      "重度污染":


        Y.append(


      4)


print(Y)


print(len(y))


X = DataArray[:,


      2:


      5]


print(X[


      1])
      for i


      in range(


      len(Y)):


   f=


      open(


      "data.txt",


      "a+")


      for j


      in range(


      3):


        f.


      write(str(X[i][j])+


      ",")


   f.


      write(str(Y[i])+


      "\n")


      print(


      "data.txt数据生成")
    def loadDataset(self,filename, split, trainingSet, testSet):  # 加载数据集  split以某个值为界限分类train和test


    with open(filename, 'r') as csvfile:


        lines = csv.reader(csvfile)   #读取所有的行


        dataset = list(lines)     #转化成列表


        for x in range(len(dataset)-1):


            for y in range(3):


                dataset[


      x][


      y] = float(dataset[


      x][


      y])


            if random.random()


      < split:   # 将所有数据加载到train和test中
                trainingSet.append(dataset[x])
            else:
                testSet.append(dataset[x])
      def calculateDistance(self,testdata, traindata, length):


      # 计算距离


    distance =


      0


      # length表示维度 数据共有几维


      for x


      in range(length):


        distance += pow((int(testdata[x])-traindata[x]),


      2)


      return math.sqrt(distance)
def getNeighbors(self,trainingSet, testInstance, k):
# 返回最近的k个边距
distances = []
length = len(testInstance)
-1
for x
in range(len(trainingSet)):
#对训练集的每一个数计算其到测试集的实际距离
dist = self.calculateDistance(testInstance, trainingSet[x], length)
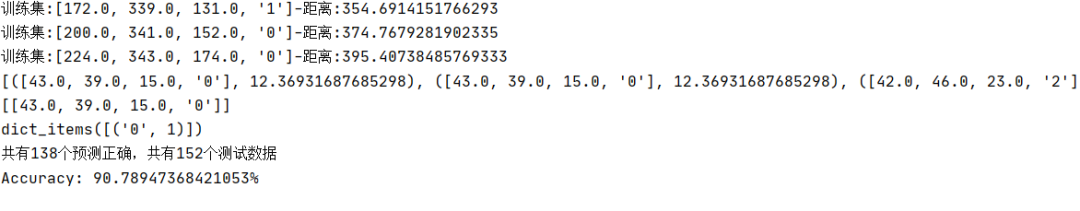
print(
'训练集:{}-距离:{}'.format(trainingSet[x], dist))
distances.append((trainingSet[x], dist))
distances.sort(key=operator.itemgetter(
1))
# 把距离从小到大排列
print(distances)
neighbors = []
for x
in range(k):
#排序完成后取前k个距离
neighbors.append(distances[x][
0])
print(neighbors)
return neighbors
    def getResponse(self,neighbors):  # 根据少数服从多数,决定归类到哪一类


    classVotes = {}


    for x in range(len(neighbors)):


        response = neighbors[


      x][


      -1]  # 统计每一个分类的多少


        if response in classVotes:


            classVotes[response] += 1


        else:


            classVotes[response] = 1


    print(classVotes.items())


    sortedVotes = sorted(classVotes.items(), key=operator.itemgetter(1), reverse=True) #reverse按降序的方式排列


    return sortedVotes[


      0][


      0]
    def getAccuracy(self,testSet, predictions):  # 准确率计算


    correct = 0


    for x in range(len(testSet)):


        if testSet[


      x][


      -1] == predictions[x]:   #predictions是预测的和testset实际的比对


            correct += 1


    print('共有{}个预测正确,共有{}个测试数据'.format(correct,len(testSet)))


    return (correct/float(len(testSet)))*100.0
      def Run(self):


    trainingSet = []


    testSet = []


    split =


      0.75


    self.loadDataset(


      r'data.txt', split, trainingSet, testSet)


      #数据划分


    print(


      'Train set: ' + str(len(trainingSet)))


    print(


      'Test set: ' + str(len(testSet)))


      #generate predictions


    predictions = []


    k =


      5


      # 取最近的5个数据


      # correct = []


      for x


      in range(len(testSet)):


      # 对所有的测试集进行测试


        neighbors = self.getNeighbors(trainingSet, testSet[x], k)


      #找到5个最近的邻居


        result = self.getResponse(neighbors)


      # 找这5个邻居归类到哪一类


        predictions.append(result)


      # print('predictions: ' + repr(predictions))


      # print('>predicted=' + repr(result) + ', actual=' + repr(testSet[x][-1]))


      # print(correct)


    accuracy = self.getAccuracy(testSet,predictions)


    print(


      'Accuracy: ' + repr(accuracy) +


      '%')


更多精彩推荐
☞阿里辟谣:不会高薪聘请黑阿里网站的人;苹果欲用 iPhone 替代身份证和护照;Python 3.9.0b4 发布| 极客头条
☞数说DApp:DeFi和DEX迅猛增长或令以太坊超越比特币
![]()
点分享 ![]()
点点赞 ![]()
点在看


登录查看更多
相关内容
Arxiv
3+阅读 · 2018年9月11日
Arxiv
3+阅读 · 2018年1月23日


相关VIP内容
相关资讯
相关论文
Arxiv
3+阅读 · 2018年9月11日
Arxiv
3+阅读 · 2018年1月23日