从零开始,用Python徒手写线性回归
选自towardsdatascience
作者:Kumud Lakara
机器之心编译
编辑:小舟、泽南
先放下 Scikit-learn,我们来看一看真正的技术。
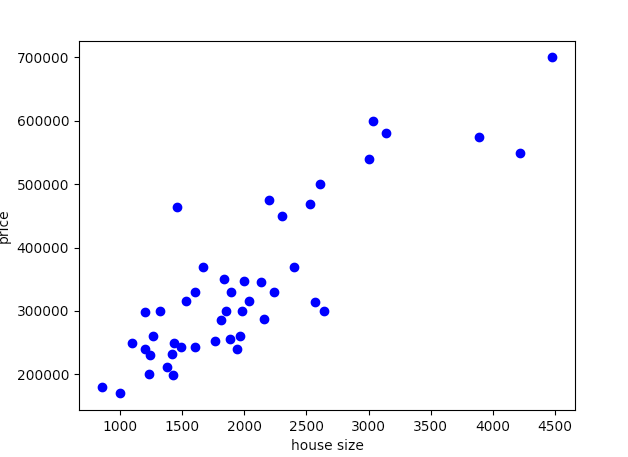
def load_data(filename):df = pd.read_csv(filename, sep=",", index_col=False)df.columns = ["housesize", "rooms", "price"]data = np.array(df, dtype=float)plot_data(data[:,:2], data[:, -1])normalize(data)return data[:,:2], data[:, -1]
Z = (x — μ) / σ
μ : mean
σ : standard deviation
def normalize(data):for i in range(0,data.shape[1]-1):data[:,i] = ((data[:,i] - np.mean(data[:,i]))/np.std(data[:, i]))
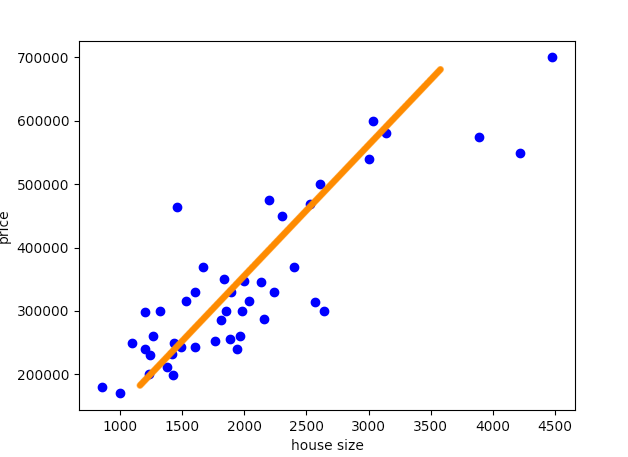
def plot_data(x, y):plt.xlabel('house size')plt.ylabel('price')plt.plot(x[:,0], y, 'bo')plt.show()

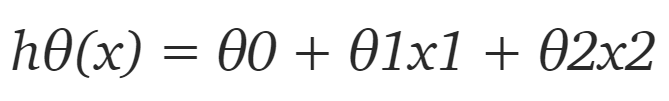
def h(x,theta):return np.matmul(x, theta)
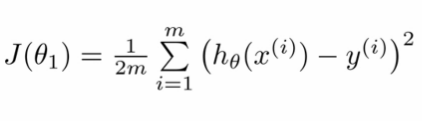
def cost_function(x, y, theta):return ((h(x, theta)-y).T@(h(x, theta)-y))/(2*y.shape[0])
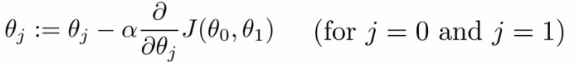
def gradient_descent(x, y, theta, learning_rate=0.1, num_epochs=10):m = x.shape[0]J_all = []for _ in range(num_epochs):h_x = h(x, theta)cost_ = (1/m)*(x.T@(h_x - y))theta = theta - (learning_rate)*cost_J_all.append(cost_function(x, y, theta))return theta, J_all
x,y = load_data("house_price_data.txt")y = np.reshape(y, (46,1))x = np.hstack((np.ones((x.shape[0],1)), x))theta = np.zeros((x.shape[1], 1))learning_rate = 0.1num_epochs = 50theta, J_all = gradient_descent(x, y, theta, learning_rate, num_epochs)J = cost_function(x, y, theta)print("Cost:", J)print("Parameters:", theta)#for testing and plotting costn_epochs = []jplot = []count = 0for i in J_all:jplot.append(i[0][0])n_epochs.append(count)count += 1jplot = np.array(jplot)n_epochs = np.array(n_epochs)plot_cost(jplot, n_epochs)test(theta, [1600, 2])
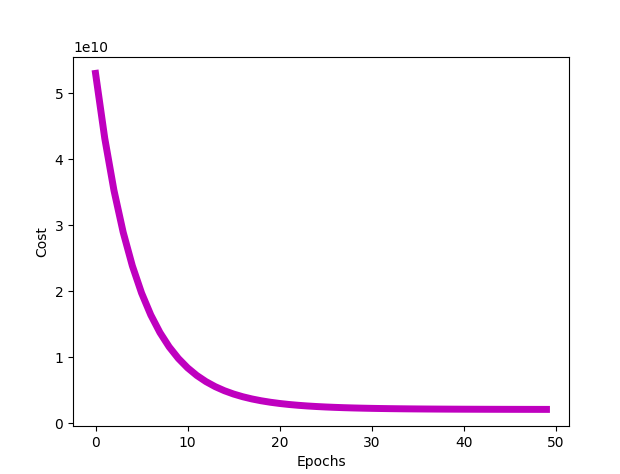
def plot_cost(J_all, num_epochs):plt.xlabel('Epochs')plt.ylabel('Cost')plt.plot(num_epochs, J_all, 'm', linewidth = "5")plt.show()
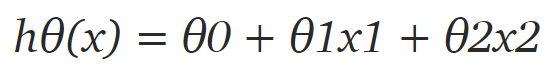
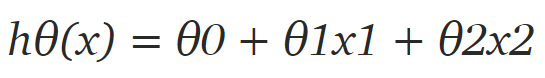
def test(theta, x):x[0] = (x[0] - mu[0])/std[0]x[1] = (x[1] - mu[1])/std[1]y = theta[0] + theta[1]*x[0] + theta[2]*x[1]print("Price of house:", y)
import numpy as npimport matplotlib.pyplot as pltimport pandas as pd#variables to store mean and standard deviation for each featuremu = []std = []def load_data(filename):df = pd.read_csv(filename, sep=",", index_col=False)df.columns = ["housesize", "rooms", "price"]data = np.array(df, dtype=float)plot_data(data[:,:2], data[:, -1])normalize(data)return data[:,:2], data[:, -1]def plot_data(x, y):plt.xlabel('house size')plt.ylabel('price')plt.plot(x[:,0], y, 'bo')plt.show()def normalize(data):for i in range(0,data.shape[1]-1):data[:,i] = ((data[:,i] - np.mean(data[:,i]))/np.std(data[:, i]))mu.append(np.mean(data[:,i]))std.append(np.std(data[:, i]))def h(x,theta):return np.matmul(x, theta)def cost_function(x, y, theta):return ((h(x, theta)-y).T@(h(x, theta)-y))/(2*y.shape[0])def gradient_descent(x, y, theta, learning_rate=0.1, num_epochs=10):m = x.shape[0]J_all = []for _ in range(num_epochs):h_x = h(x, theta)cost_ = (1/m)*(x.T@(h_x - y))theta = theta - (learning_rate)*cost_J_all.append(cost_function(x, y, theta))return theta, J_alldef plot_cost(J_all, num_epochs):plt.xlabel('Epochs')plt.ylabel('Cost')plt.plot(num_epochs, J_all, 'm', linewidth = "5")plt.show()def test(theta, x):x[0] = (x[0] - mu[0])/std[0]x[1] = (x[1] - mu[1])/std[1]y = theta[0] + theta[1]*x[0] + theta[2]*x[1]print("Price of house:", y)x,y = load_data("house_price_data.txt")y = np.reshape(y, (46,1))x = np.hstack((np.ones((x.shape[0],1)), x))theta = np.zeros((x.shape[1], 1))learning_rate = 0.1num_epochs = 50theta, J_all = gradient_descent(x, y, theta, learning_rate, num_epochs)J = cost_function(x, y, theta)print("Cost:", J)print("Parameters:", theta)#for testing and plotting costn_epochs = []jplot = []count = 0for i in J_all:jplot.append(i[0][0])n_epochs.append(count)count += 1jplot = np.array(jplot)n_epochs = np.array(n_epochs)plot_cost(jplot, n_epochs)test(theta, [1600, 3])

© THE END
转载请联系本公众号获得授权
投稿或寻求报道:content@jiqizhixin.com
登录查看更多
相关内容

Arxiv
3+阅读 · 2018年11月8日


相关VIP内容
相关资讯
相关论文
Arxiv
3+阅读 · 2018年11月8日